A strong 2025, three very different regions, and why a statewide number can hide a crash.
Montana’s large-ranch market had a busy 2025. Sales of 640 acres and larger were up 30% in count and 65% in dollar volume over 2024. Underneath that headline, the state’s three regions behaved very differently, and a few single sales moved the numbers more than most people would guess.
I presented this work at the 2026 Agricultural Economics Conference at Montana State University in October. This post walks through what sold, where values went, and why the same data tells two different stories depending on whether you look at dollars or percentages.
About this data. This is a general market overview, not an appraisal, and it isn’t meant to describe any single property or property type. It draws on recorded sales in private sales databases and isn’t all-inclusive. Sales have also become harder to confirm in recent years, with more pocket listings, more non-disclosure agreements, and more private deals done without a broker or agent.
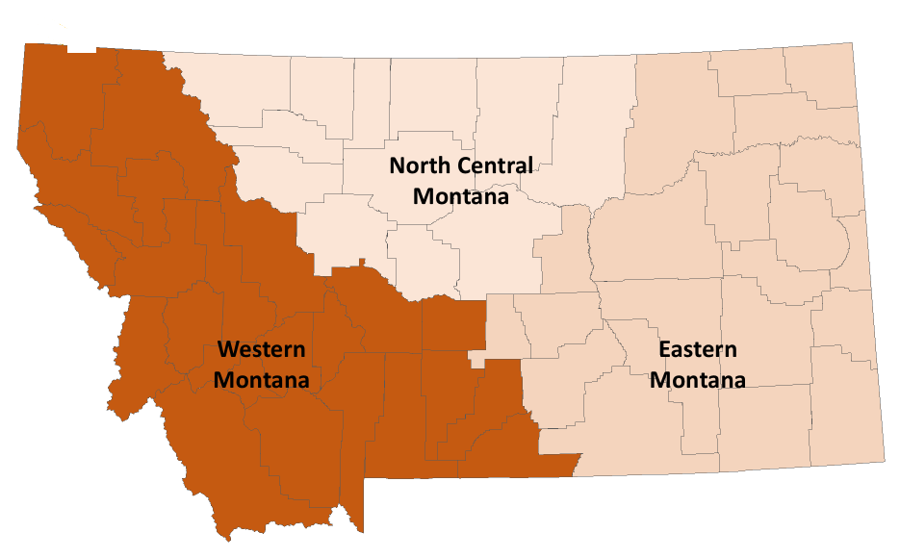
Three regions, three markets
For this overview I split Montana into three regions, Western, North Central and Eastern. They differ in land use, buyers and price, and as you’ll see, their values have moved on different schedules.
A strong 2025 statewide
Every measure of large-parcel activity rose from 2024 to 2025, and dollar volume rose fastest.
| 640+ acres | 2024 | 2025 | Change |
|---|---|---|---|
| Transactions | 137 | 178 | +30% |
| Acres sold | 400,307 | 517,460 | +29% |
| Dollar volume | $663.3M | $1.09B | +65% |
A 65% jump in dollar volume does not mean land prices rose 65%. Dollar volume is the total paid for everything that sold, so it climbs when more land trades or when more of what trades is high-priced ground. It reflects what sold, not where the market moved.
That’s what happened in 2025. Dollars grew more than twice as fast as acres, and most of that gap comes from where the land sold. Western Montana accounted for 30% of large-parcel transactions but 59% of the dollar volume.
Here’s what we’ve recorded so far in 2026, through September 30.
That’s a partial year, and recent sales are the hardest to confirm, so I wouldn’t compare it to 2025 yet. For how prices themselves moved, the medians in the next section are the better guide.

Where values went, 2020 to 2025
Median unimproved values rose in every region, but not at the same pace or at the same time.
Western land costs the most per acre by a wide margin. But the dollar gap hides which region has actually gained the most, so the next chart shows each region’s change from its own 2020 level.
North Central, where one ranch made the record year
North Central Montana traded between 108,000 and 127,000 acres of large parcels in most years from 2020 to 2025. The exception was 2023, at 143,700 acres. About 66,000 of those acres came from a single sale, the IX Ranch. Take that one sale out and 2023 looks like a slow year, not a record.
Values tell a story of patience. The median went from $1,080 an acre in 2020 to $1,280 in 2025, a 19% gain over five years. Almost all of it came after 2022. Values rose about 0.4% a year from 2020 to 2023, then about 8.3% a year from 2023 to 2025. The 2026 median so far is $1,635 an acre, but that rests on just 22 sales, too few to call a trend.
Eastern, with the biggest ranches and the biggest gains
Eastern Montana is where the very large ranches trade. In 2021, ten ranches of more than 10,000 acres each changed hands, and the region sold 411,712 acres across 105 sales, with about $315 million in dollar volume. No year since has come close.
Eastern values have also risen the most. The median went from $608 an acre in 2020 to $1,097 in 2025, an 80% gain. Growth sped up after 2022. Values rose about 9.9% a year from 2020 to 2023, then about 16.6% a year from 2023 to 2025. Eastern ground still sells for the lowest prices per acre in the state, but in percentage terms it has been the strongest large-ranch market of the last five years.
Western, with fewer acres and far more money
Western Montana trades the fewest acres and the most dollars. In 2025 the region sold 146,240 acres of large parcels for $643 million, more than North Central and Eastern combined. Dollar volume peaked at about $1.28 billion in 2021.
The 2020 acreage includes Weyerhaeuser’s sale of about 630,000 acres of industrial timberland. That’s a timber portfolio, not the farm and ranch market this overview covers, so I read 2020 with that sale set aside.
Western values ran up fastest during the COVID years, about 17.5% a year from 2020 to 2023, taking the median from $1,760 an acre to $2,850. Since then they’ve leveled off, at about 1.6% a year, reaching $2,941 in 2025.
The median dipped to $2,140 in 2024. That wasn’t land getting cheaper. Fewer upper-tier ranches sold that year, and when the top of the market goes quiet, the median falls even if prices hold. Keep that in mind, because it’s exactly what happened after 2008.
Is demand shifting from Western Montana to the rest of the state?
Since 2023 the momentum has shifted. Western medians rose about 17.5% a year through 2023 and only about 1.6% a year since. Over the same years Eastern and North Central sped up. I don’t think one cause explains it. It looks like a mix of price, supply and ranch economics.
- Western prices hit a ceiling. After the COVID run-up and higher interest rates, fewer buyers were willing to pay Western prices. Large-parcel sales there fell from 84 in 2021 to 30 in 2024. When sales came back to 54 in 2025, the median barely moved. Brokers tell me buyers are pushing back on price, while many sellers are still anchored to what the market brought a few years ago. That friction slows sales more than it lowers prices.
- Western supply is thin. Fewer large Western ranches are coming to market. Buyers who want size, water and amenities can find more of them per dollar farther east.
- Ranch economics helped, up to a point. Strong cattle prices raised what grazing land can earn, which supports Eastern and North Central values. But input costs keep climbing, so cattle prices alone don’t explain gains this fast.
Here’s what I’m watching to tell these apart.
- Where the gains are. If Eastern and North Central gains are strongest near the Western boundary and in higher-amenity areas, that points to buyers moving east. Even gains across production ground point to ranch income.
- Who’s buying. A growing share of out-of-area buyers in the East would be a clear sign that Western demand is spilling over.
- How Western listings sell. Quick sales near asking price mean supply is the limit. Longer market times, price cuts and listings that expire or are pulled without selling mean buyers are the limit. Those unsold listings never show up in sales data, so closed sales alone can make a stalled market look steadier than it is.
- Ranch margins. If input costs keep rising and cattle prices ease from their highs, Eastern and North Central values will lean more on outside buyers.
That last point matters for the outlook. Values supported by what the land earns tend to hold. Values supported by buyers priced out of somewhere else depend on that somewhere else staying expensive. My read is that recent Eastern and North Central gains rest on both, which makes them worth watching closely over the next few years.
Dollars vs. percentages
The same sales can answer two different questions, and the answers don’t always agree. For the second half of the talk, I built two sets of maps from 26 years of Montana sales (2000–2026), about 13,900 sales after trimming extreme outliers.
The dollar map asks where land is worth the most. It shows interpolated dollar-per-acre values for each five-year period on one fixed color scale. The percentage map asks where value is changing fastest. It shows the percent change in those same values from one period to the next.
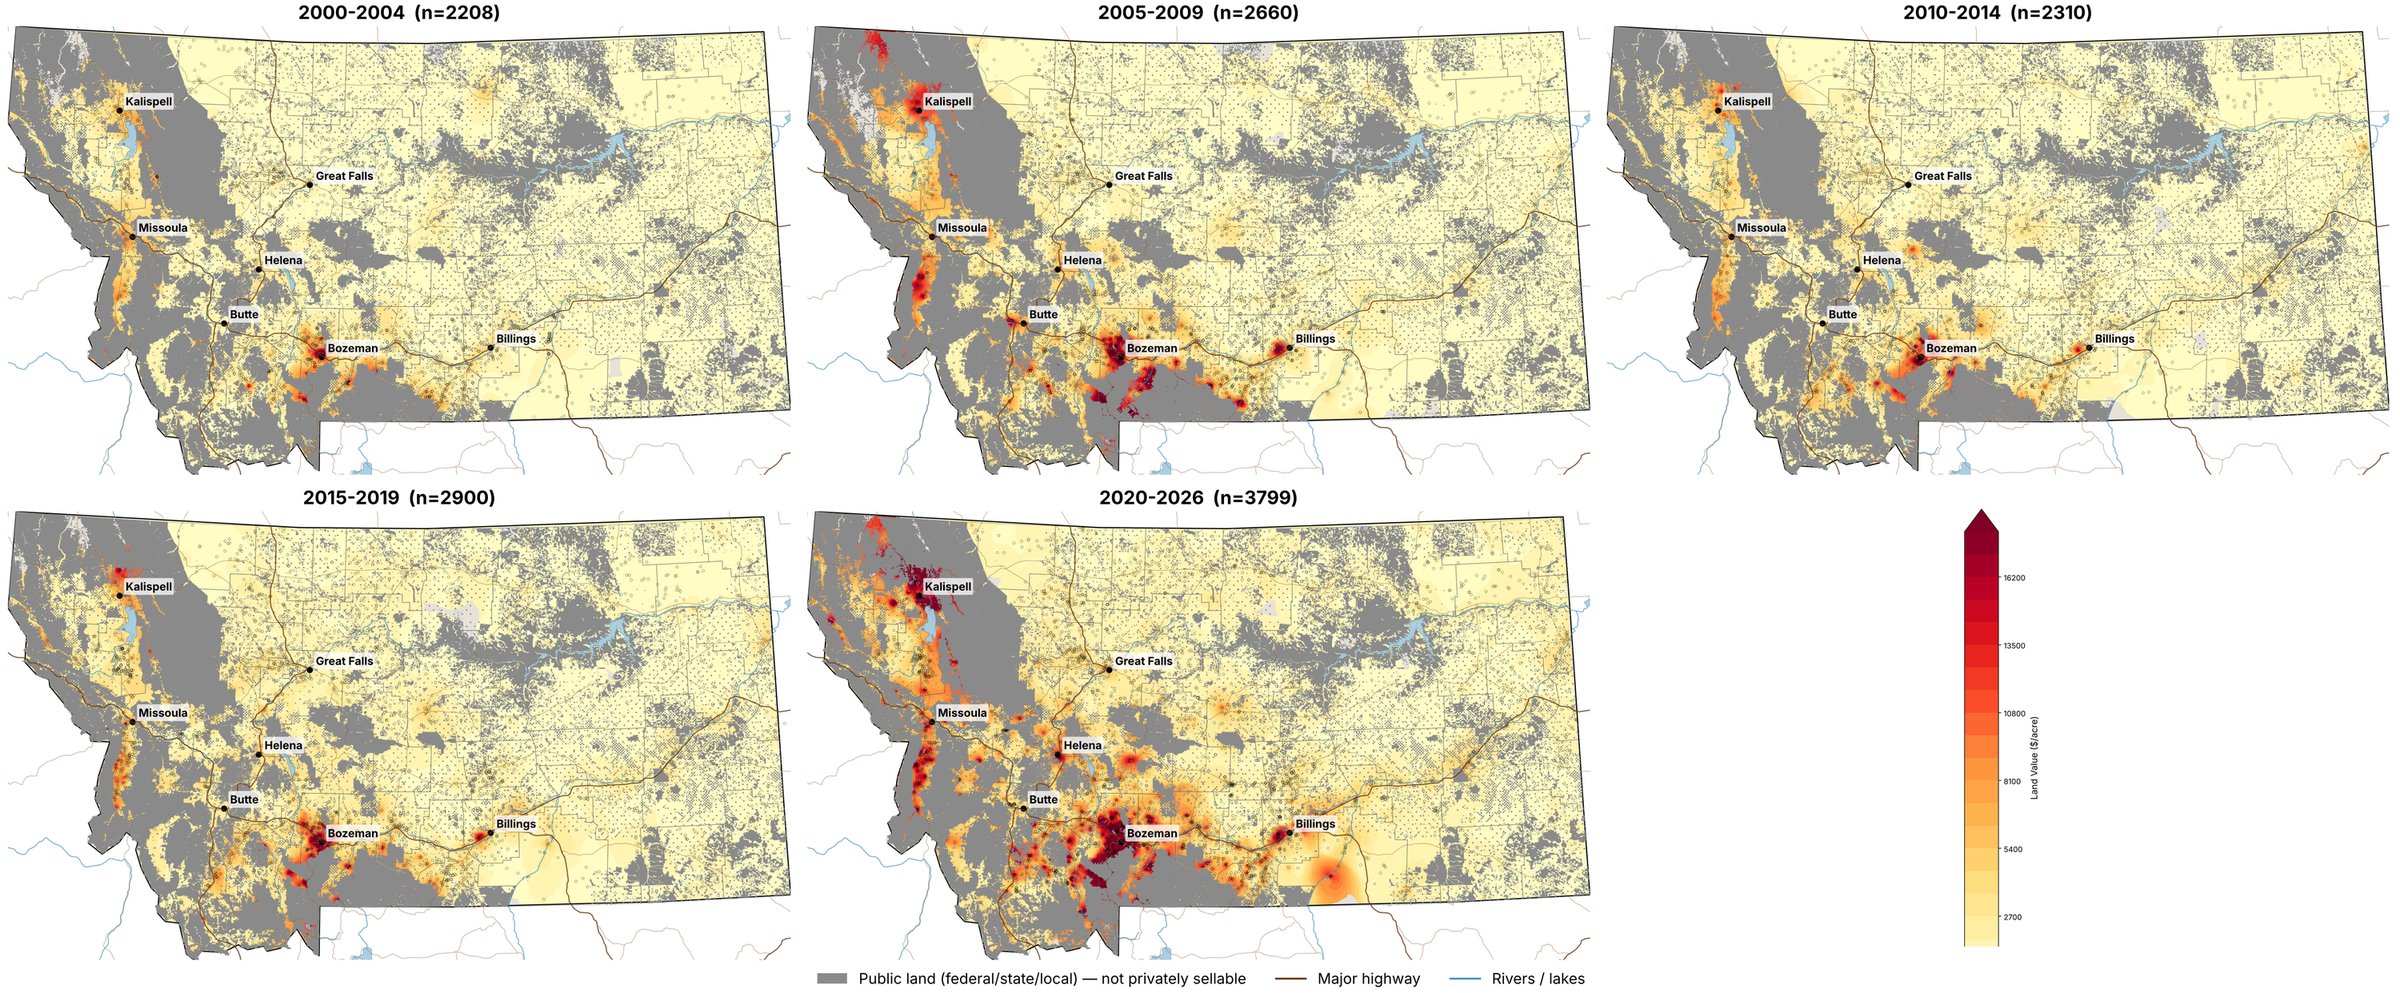
Click or tap the maps to enlarge. The dollar maps, 2000–2004 through 2020–2026. Darker red means higher $/acre. The high-value ground sits in the West, around Kalispell, Missoula, the Bitterroot and Bozeman, in every period.
The dollar maps look much the same from period to period. The percentage maps are where the surprises are.
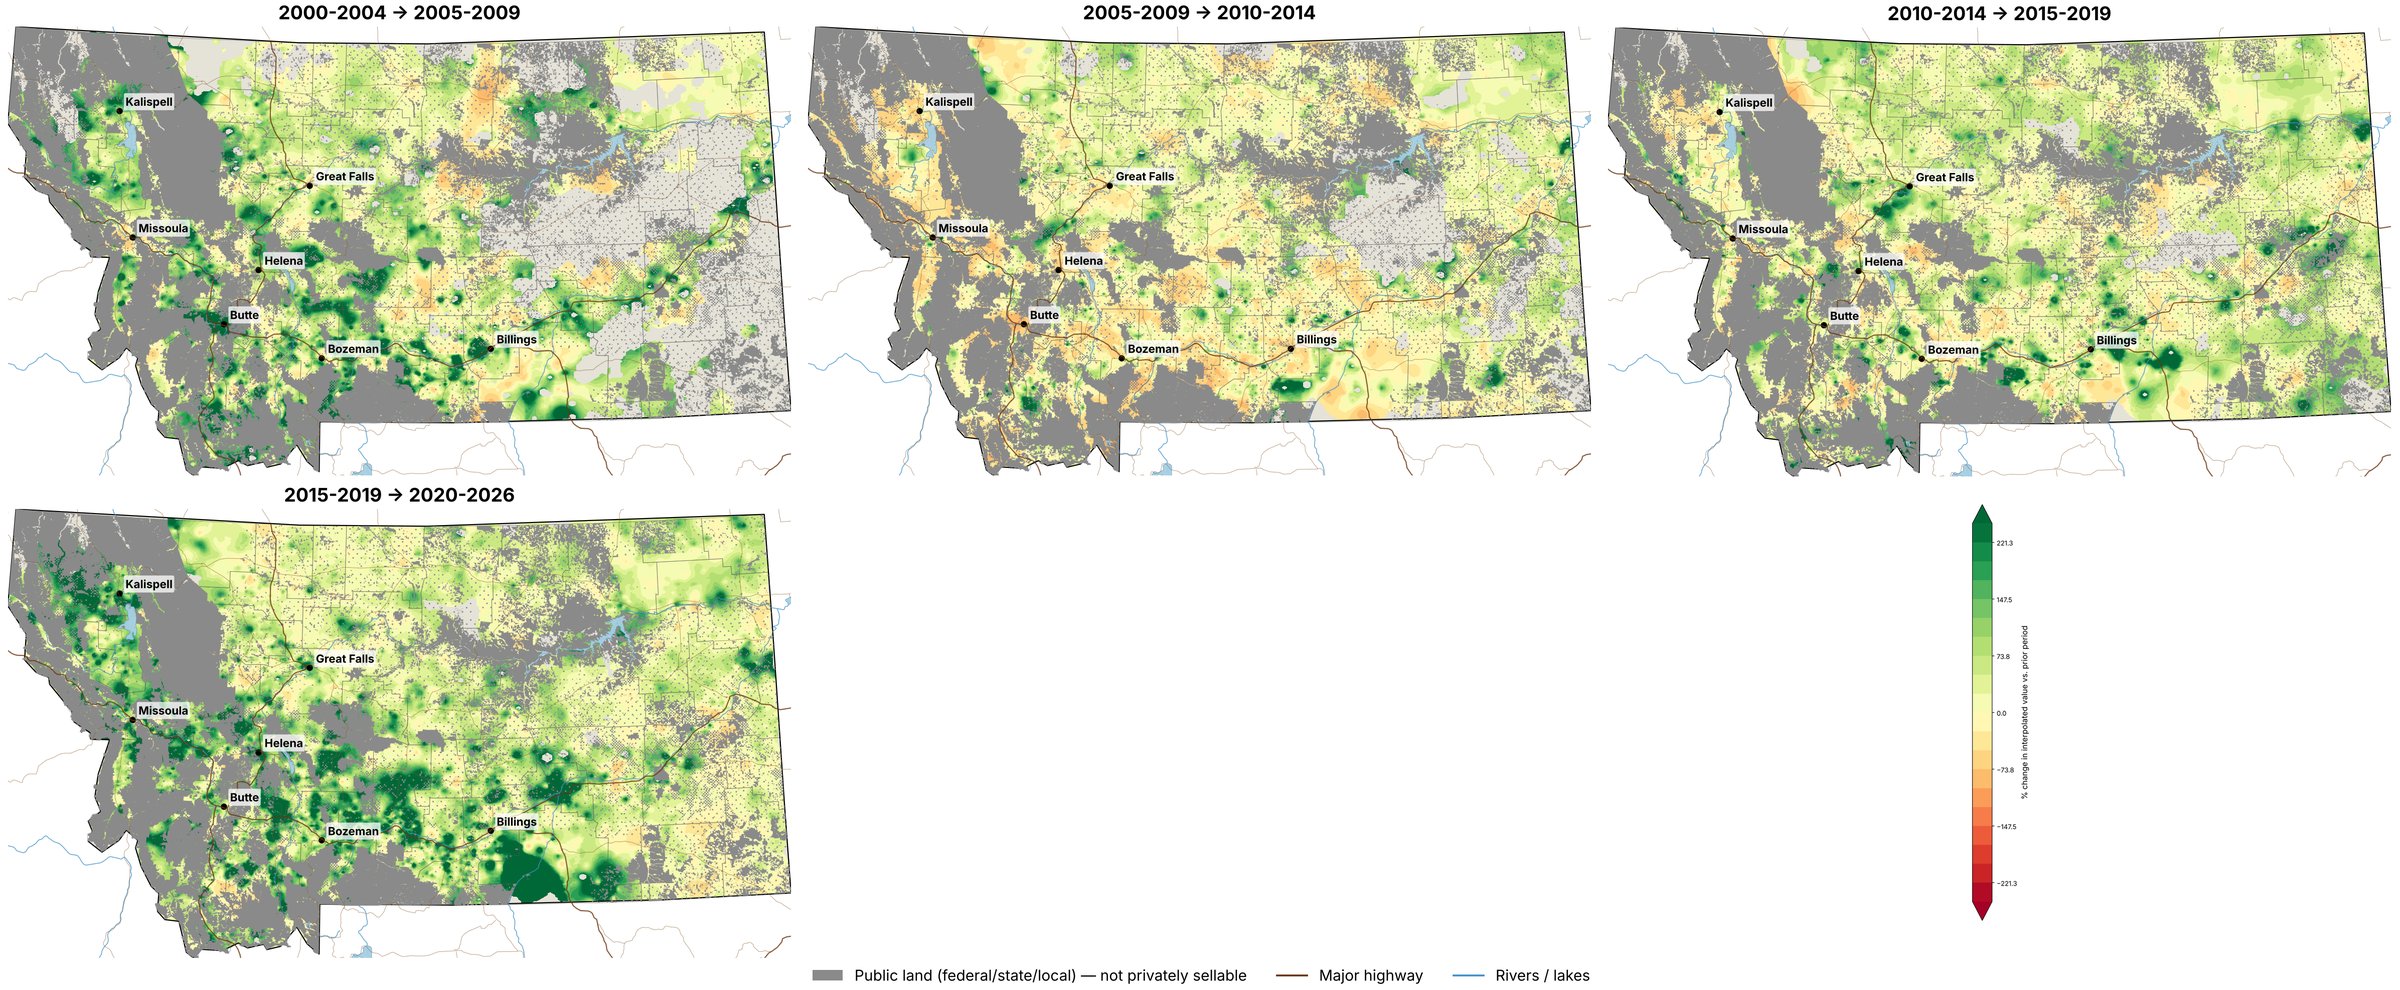
Click or tap the maps to enlarge. The percentage maps, change from one five-year period to the next. Green gained value, and orange and red lost it. The 2005–09 to 2010–14 map is the only one with broad losses, and they sit in the West.
When the top of the market went quiet
The biggest surprise in the percentage maps is 2008. From 2005–09 to 2010–14, values statewide barely moved, up just 0.4%. That looks like a pause. Underneath, Western Montana fell 25% while North Central gained 14% and Eastern gained 20%.
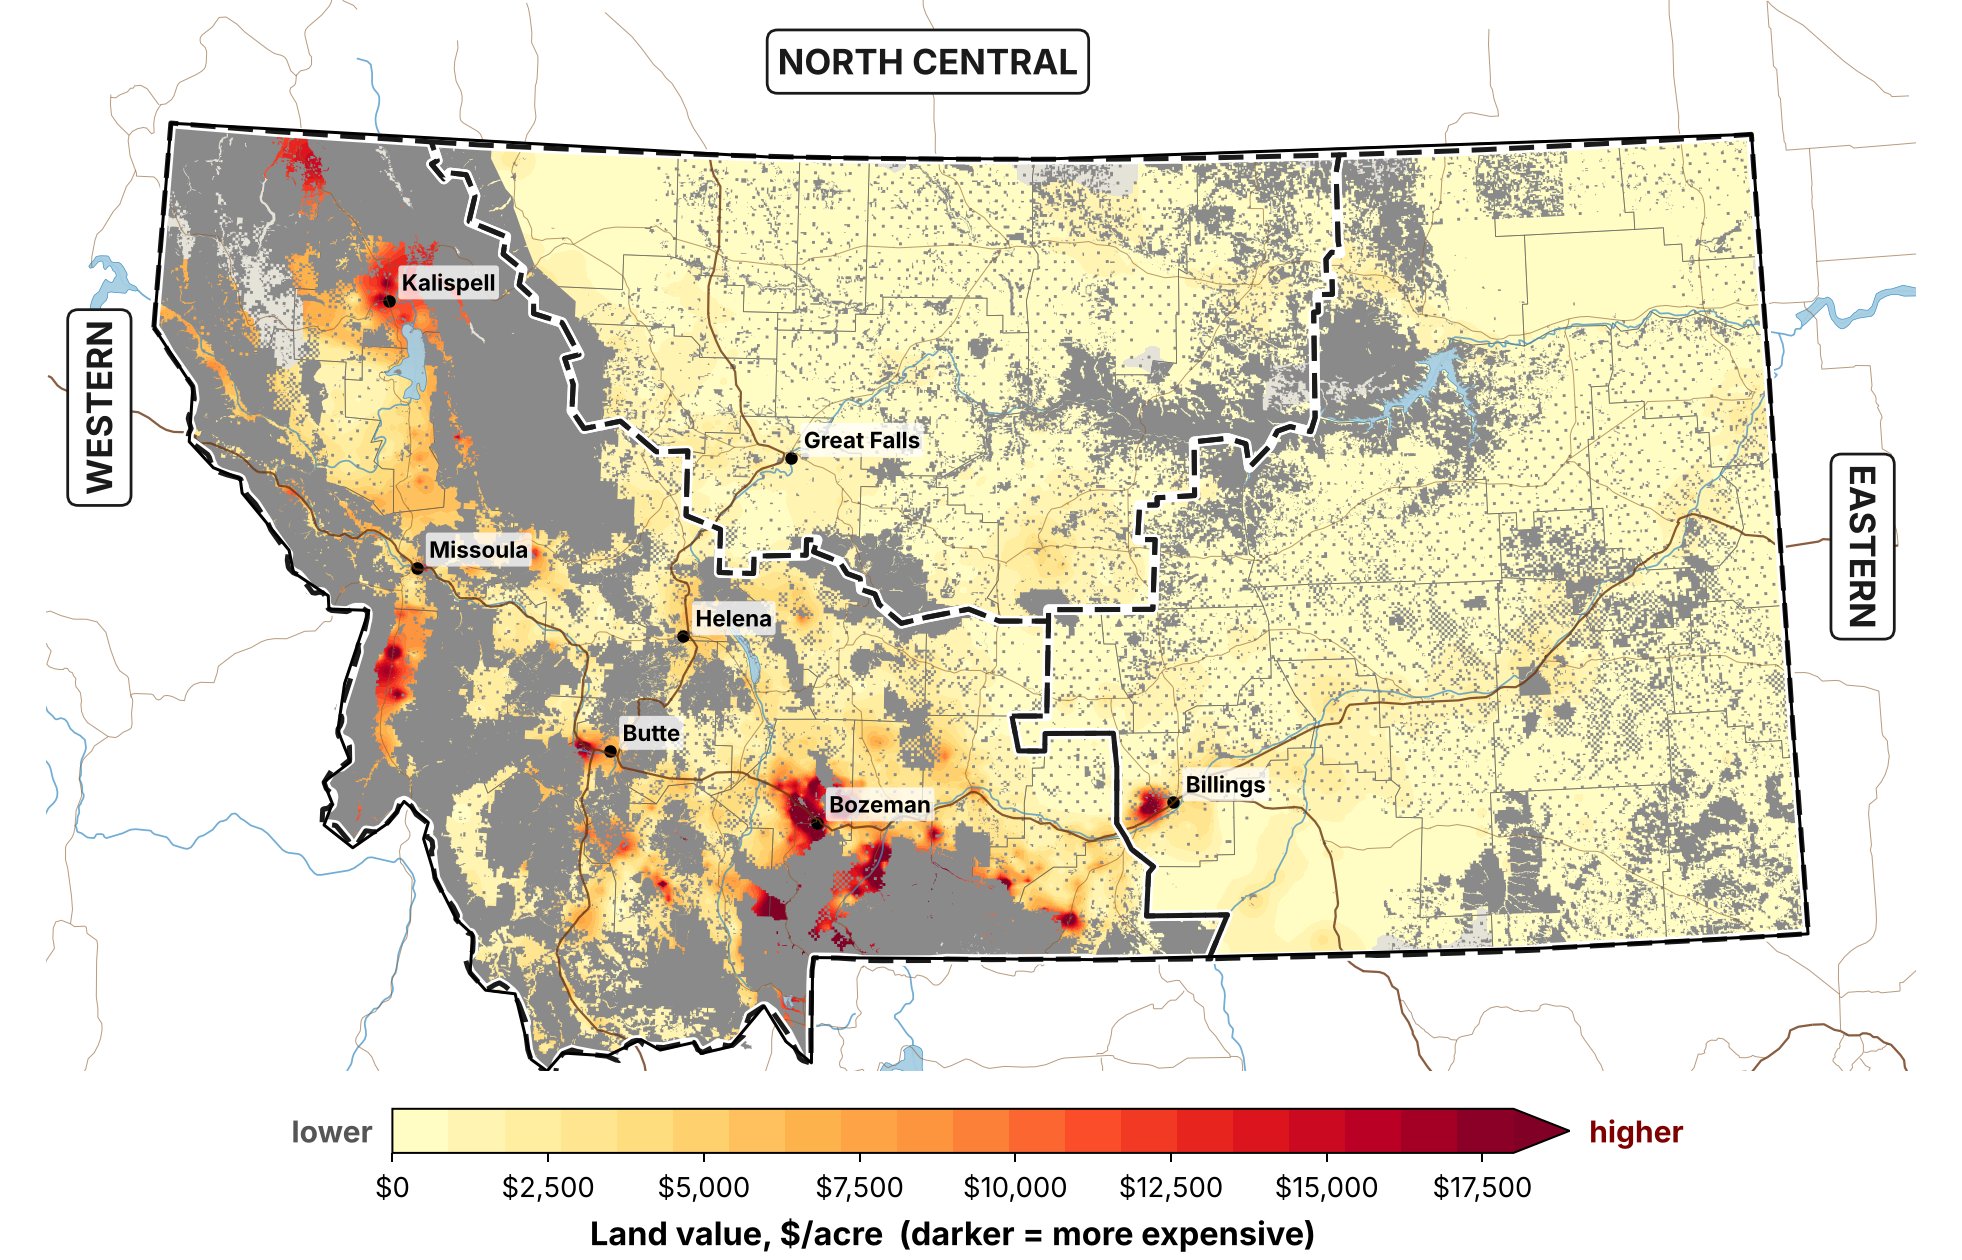
Dollar map, 2005–2009. Where the money was at the peak.
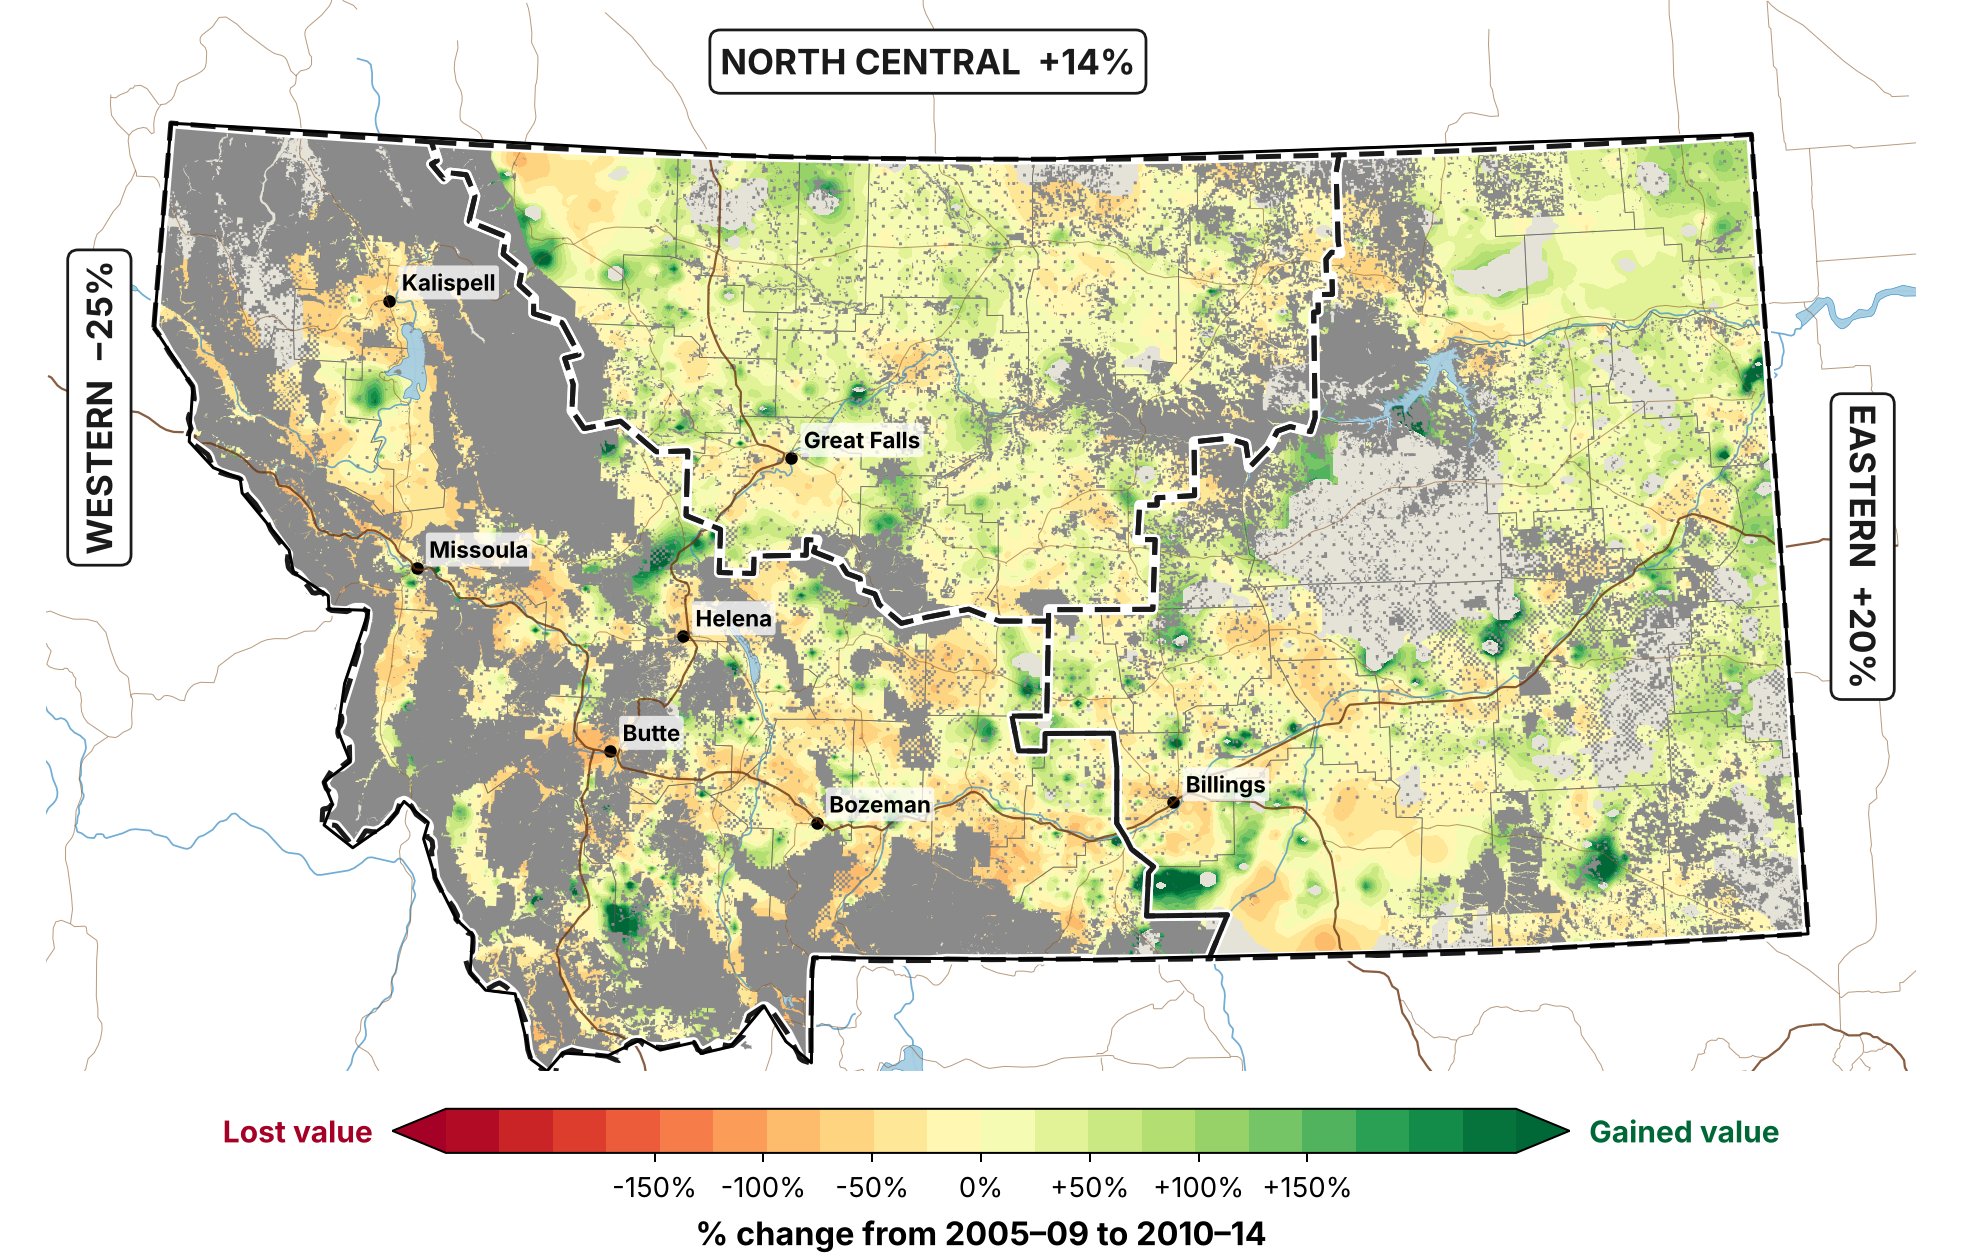
Percentage map, 2005–09 → 2010–14. Orange and red lost value, and green gained.
The Western drop had two parts. Lower- and middle-tier land lost about 20%. The rest came from the high-amenity tier going quiet. Top-tier sales fell by half, so fewer expensive properties were in the mix.
It’s the only decline any region posted in 26 years, and a statewide number hid it completely.
The takeaway
When a number moves, ask what sold.
After 2008, statewide values looked flat while the West fell 25% as its top tier stopped trading. In 2024, the Western median dipped because fewer upper-tier ranches sold, not because land got cheaper. And in North Central, a single ranch turned 2023 into a record year for acres traded.
The dollar map shows where land is worth the most. The percentage map shows where value is moving. Read together, they’re more honest than either one alone.
Methods. Medians are unimproved land value per acre for sales of 640 acres and larger, all land classes combined. The maps use inverse-distance-weighted interpolation of unimproved land value ($/acre), clipped to the Montana state boundary, built from two proprietary sales databases. Sales above the 99.5th percentile were trimmed before interpolation.


Michael F. McDonnell, MS, ARA
Norman C. Wheeler & Associates · Since 1958
mike@ncwheeler.com · 406-208-5382 · www.ncwheeler.com