Reading the geography of price in the Treasure State
By Michael McDonnell, MS, ARA and Thomas Kingsbury, GIS Specialist
There’s a version of the Montana land story everyone already knows: Bozeman got expensive, out-of-staters showed up during the pandemic, and ranches near ski towns now sell for numbers that make longtime landowners wince. But when you plot individual land sales going back to 1989 and let the data draw its own picture, the story gets more specific, and more interesting, than the headlines.
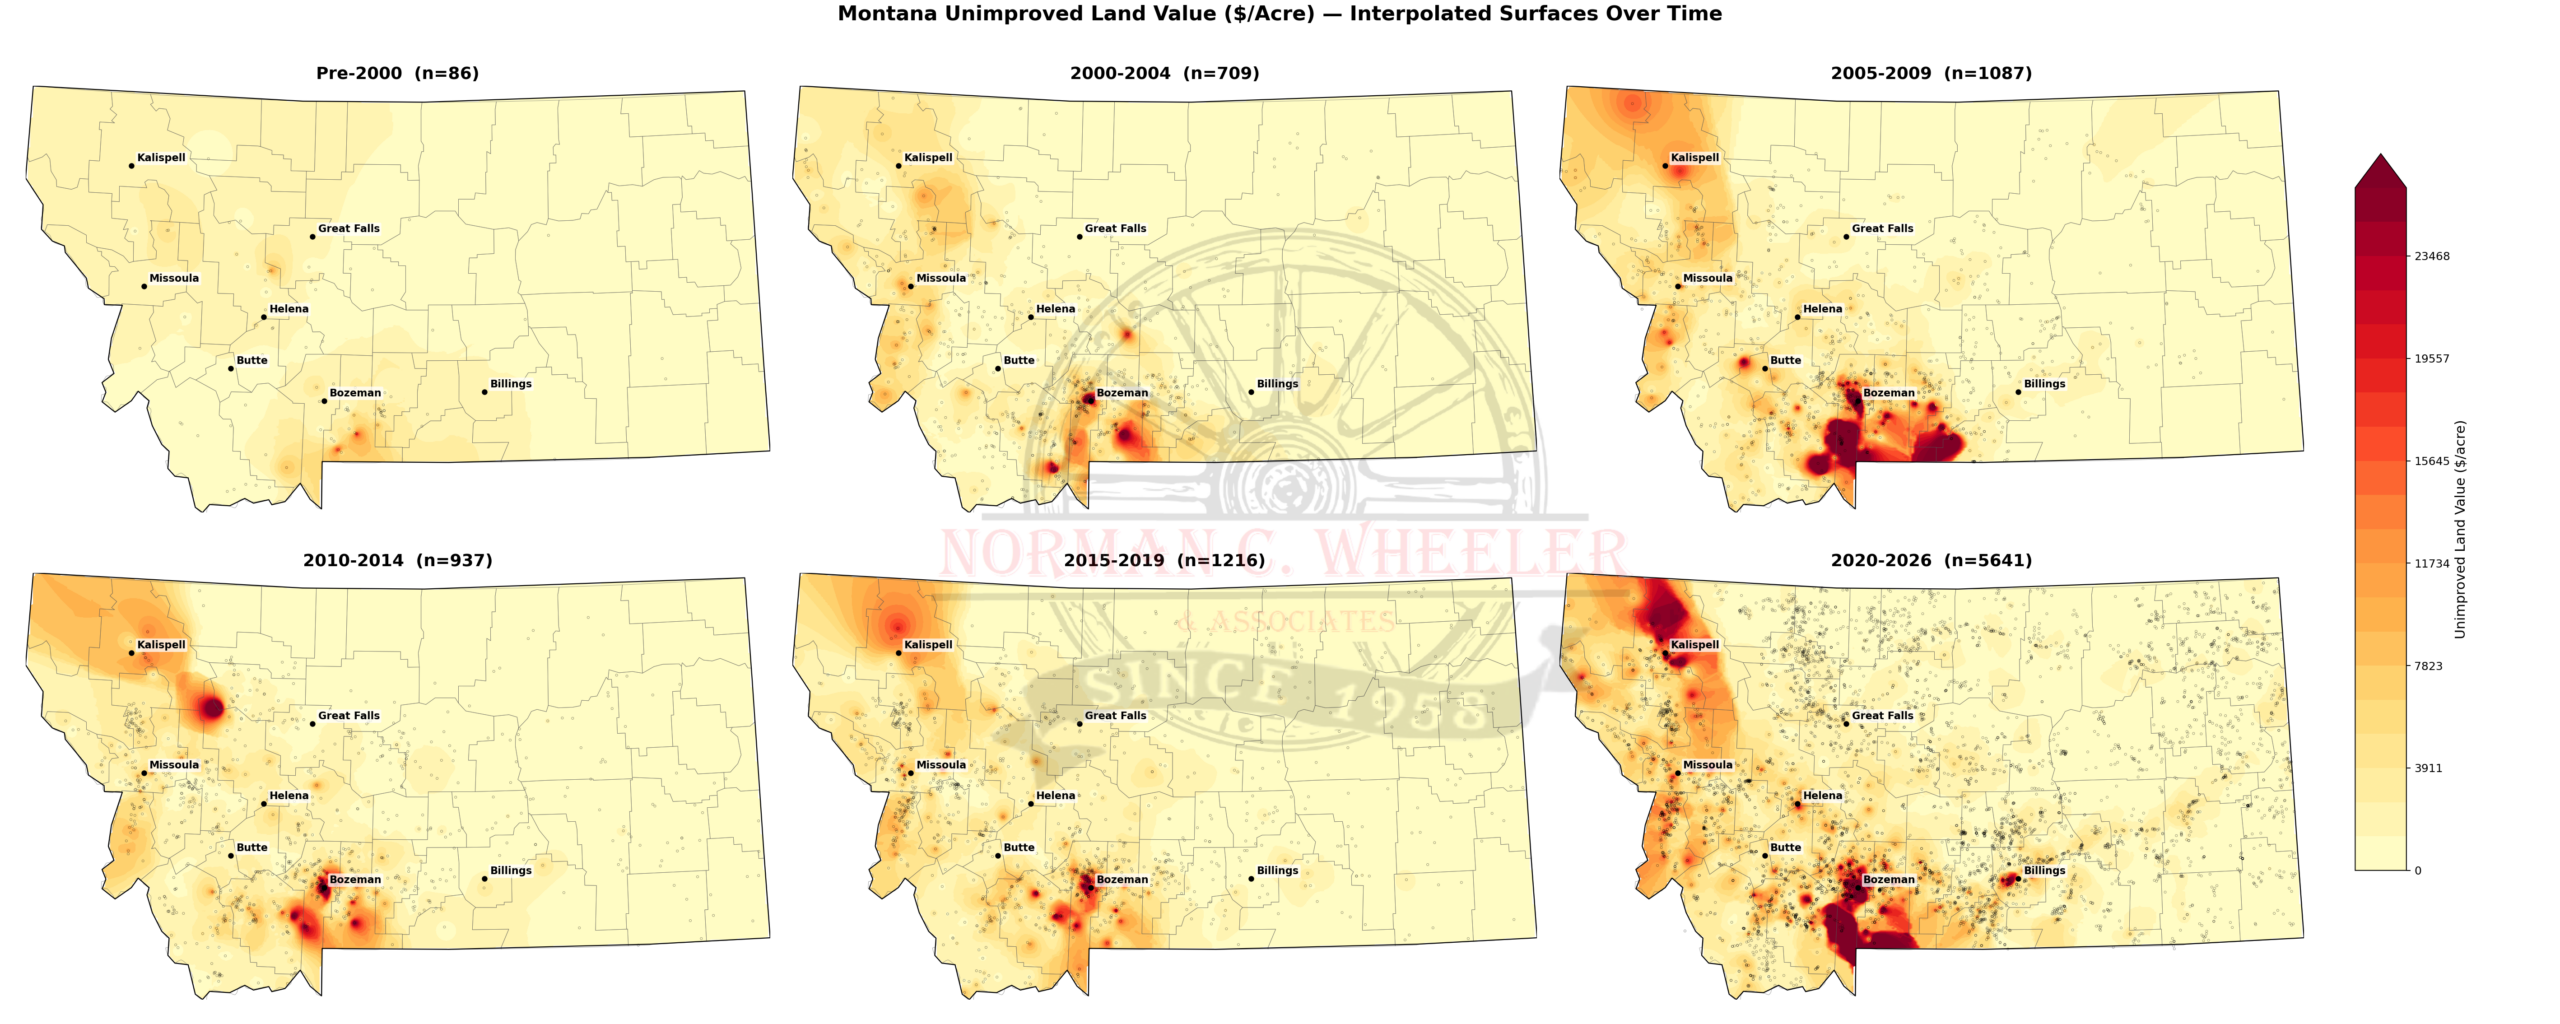
We took unimproved land value ($/acre) from two internal sales databases, interpolated it into a continuous surface across the state, and broke it into six time windows. Laid side by side, the six maps don’t just show numbers going up. They show where the money went, and the pattern is remarkably consistent.
The same corner of the state, every single time
Look at any of the six panels and your eye goes to the same place: a band running through the southwest and west-central part of Montana, through Flathead, Lake, Missoula, and Ravalli Counties in the northwest, and Madison, Gallatin, and Park Counties in the southwest. In every era, from the 1990s through 2026, this is where the color intensifies. Land values across the eastern two-thirds of the state have risen too, just at a lower, slower rate, and that region has benefited from the limited supply of land in the areas where values have intensified the most.
That’s the first real finding, and it’s easy to miss if you only look at one map at a time: this was overwhelmingly a regional land boom, not a strictly statewide one. It’s a persistent, geographically narrow premium for recreational and amenity land, layered on top of an eastern Montana land market that has moved at a much slower, steadier pace the entire time. This claim used to come with a big caveat — our older data was western-heavy, so a flat-looking east could just mean thin coverage. But the 2020–2026 panel now includes a second, much broader sales database with real points scattered across the eastern counties, and the story largely holds: even with good statewide coverage, eastern Montana stays comparatively cheap while the western corridor lights up most intensely. That’s a meaningfully stronger version of the same finding.
A timeline that tracks the news
Once you place the maps against the calendar, they start to read like an economic history of rural Montana:
Pre-2000 to 2004, the quiet years. Values are low and diffuse. There’s a faint glow starting around Gallatin and Madison Counties, but nothing dramatic yet. This is right around when destination and recreational ranch buying started gaining traction in Montana — the early Big Sky/Yellowstone Club era — but the broader market hadn’t caught on.
2005–2009, the first real cluster. The Gallatin/Park/Madison hot spot sharpens noticeably here. This window spans the national land and housing bubble that preceded the 2008 financial crisis, and tellingly, the color doesn’t collapse even though the panel runs through the crash. Rural recreational land appears to have held its value better than residential real estate did, though thinner sales volume in the down years may also be smoothing over some of the damage.
2010–2014, recovery, and a second front opens. A new hot spot appears in the northwest, around Flathead County. Cheap credit and post-crisis recovery money start flowing back into recreational property, and this time it’s not just one valley.
2015–2019, the slow boil. Rather than one sharp peak, this period shows several mid-intensity clusters spreading across the corridor. The premium is broadening out from its original hot spots rather than intensifying in just one place — early evidence of the corridor-wide “amenity migration” that would explode a few years later.
2020–2026, the reckoning. This is, by a wide margin, the most intense and most widely clustered panel of the six, and now the best-supported, drawing on a far more robust dataset than any prior period. Flathead, Gallatin, and Park Counties all show deep-red peaks simultaneously, and for the first time we can see eastern Montana clearly too — and it stays low. This is the COVID-era rural land rush in data form: remote work untethering buyers from cities, a well-documented surge of out-of-state purchasers, and national press coverage of Bozeman and the Flathead Valley as flashpoints of the “Zoom town” phenomenon. And the fact that elevated values persist into 2025–2026, rather than snapping back, suggests this wasn’t a temporary spike — the repricing has stuck.
A caveat worth sitting with
These are nominal dollars, not adjusted for inflation. Some of the 35-year climb is simply the price of everything going up. But inflation is a poor explanation on its own: it doesn’t explain why the increase concentrates so precisely in the same seven counties, sale after sale, decade after decade, while eastern Montana barely moves. Broad currency effects would show up everywhere. What we’re looking at instead is localized demand — for views, rivers, proximity to ski towns and national parks — expressed clearly enough in the data that it survives even a crude interpolation, and now confirmed by a much more geographically complete recent dataset.
For more information or to join our mailing list, visit www.ncwheeler.com.
Michael F. McDonnell, MS, ARA
Email: mike@ncwheeler.com
Phone: 406-208-5382
Paraic Neibergs, MA, ARA
Email: neibergs@ncwheeler.com
Phone: 406-544-2740
Thomas Kingsbury, GIS Specialist
Email: tom@ncwheeler.com
Phone: 406-599-8374