Montana’s rural land market strengthened through 2025, with both transaction counts and dollar volume rebounding from a slower 2024. This report walks through what verified sales data shows across North Central, Eastern, and Western Montana, drawing on transactions of 40 acres and larger, with additional detail on 640-acre-and-larger ranch- and farm-scale deals.
This report is intended as a general overview of market conditions. It is not intended to represent an appraisal, and it is not intended to be representative of any single property or property type. The underlying data is not all-inclusive; it reflects the transactions our team was able to identify and verify, not a complete census of every sale in the state.
Confirming rural land sales has grown more difficult in recent years. A rising share of activity now moves through pocket listings — properties that are never exposed to the open market — and there has been a marked increase in non-disclosure agreements and off-market transactions completed privately, without a broker or agent involved. Readers should treat the figures below as directional indicators of market conditions rather than an exhaustive record of every transaction.
Statewide Overview
The Montana Land Market
Two segments are tracked throughout this report: properties 40 acres and larger, which captures the broad market, and properties 640 acres and larger, which isolates larger ranch- and farm-scale transactions.
Properties 40 Acres & Larger
| Year | Transactions | Acres Sold | Dollar Volume |
|---|---|---|---|
| 2024 | 314 | 360,913 | $795,119,533 |
| 2025 | 378 | 418,089 | $1,091,734,792 |
| % Change | +20% | +16% | +37% |
For context, 2023–2024 had moved in the opposite direction: transactions -15%, acres sold -22%, dollar volume -20%.
Properties 640 Acres & Larger
| Year | Transactions | Acres Sold | Dollar Volume |
|---|---|---|---|
| 2024 | 93 | 315,166 | $535,613,506 |
| 2025 | 126 | 363,927 | $814,863,724 |
| % Change | +26% | +13% | +34% |
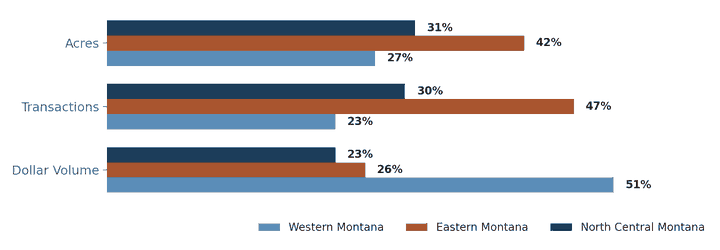
North Central, Eastern, and Western Montana each contribute a distinct share of statewide activity. Eastern Montana leads in transaction count and acreage. Western Montana, despite fewer transactions and acres, accounts for the largest share of dollar volume, reflecting higher per-acre values in that market.
Statewide Median Value Trend
Looking at median dollar-per-acre values for properties 40 acres and larger across all of Montana, the market posted a cumulative gain of 58% from 2020 to 2025 (+9.57% annually). Nearly all of that appreciation came early in the period. Values rose +55.4% from 2020–2022 (+24.66% annually) before leveling off to a modest +1.70% gain from 2022–2025 (+0.56% annually).
North Central Montana
Land Class & Value Trends
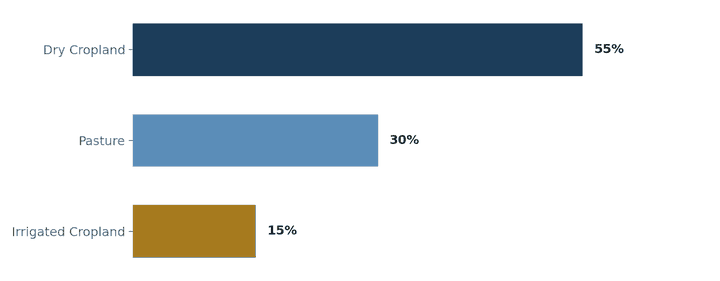
North Central Montana’s market is anchored by dry cropland and grazing country, with irrigated farm ground and recreational acreage adding meaningful upside in select micro-markets.
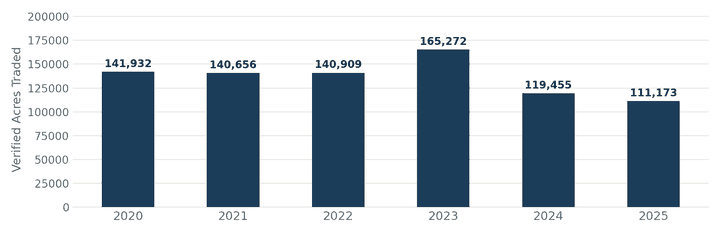
Verified Acres Traded, 2020–2025
Dollar Volume, 2020–2025
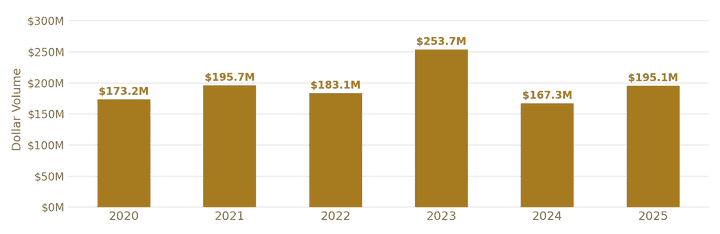
2023 marked a recent peak in both acreage and dollar volume; 2025 activity settled back near the six-year average.
Land Class Composition
Regional Median Value Trend
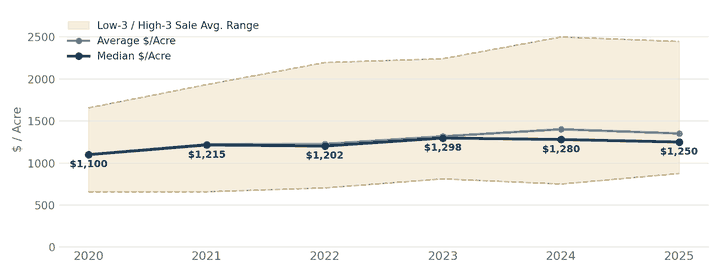
Median dollar-per-acre values in North Central Montana (properties 40 acres and larger, all land types) rose 22% from 2020 to 2025 (+4% annually): a +19.4% run from 2020–2022 (+9.26% annually), followed by a more modest +2.1% gain from 2022–2025 (+0.69% annually). This was a steadier, more moderate trajectory than the statewide average over the same period.
Dry Cropland
Irrigated Cropland
Recreationally Influenced Pasture
Grazing Pasture
Notable North Central Properties
| Property | County | Acres | Price / Status |
|---|---|---|---|
| Anchor Ranch | Blaine | 22,800 | $35,969,850 List |
| Lord Ranch | Cascade | 4,900 | $14,500,000 List |
| Salt Creek Ranch | Fergus | 3,600 | $7,500,000 List |
| Half Moon Ranch East | Fergus | 1,700 | $6,700,000 List |
| Golden Triangle Irrigated Farm | Pondera / Toole | 2,100 | $6,500,000 List |
| Deep Canyon Ranch | Teton | 580 | $4,900,000 List |
| Milk River Treasure Ranch | Blaine | 4,200 | $3,895,000 List |
| Harrison Place | Judith Basin | 1,600 | $3,749,000 List |
| Plum Creek Ranch | Fergus | 2,100 | $3,300,000 List |
| Grizzly Ridge Bison Ranch | Glacier | 28,300 | Not Listed |
| Deer Creek Ranch | Fergus | 4,100 | Not Listed |
| Monette Farm | Hill / Chouteau | 17,300 | Not Listed |

Eastern Montana
Verified Activity & Land Values by Class
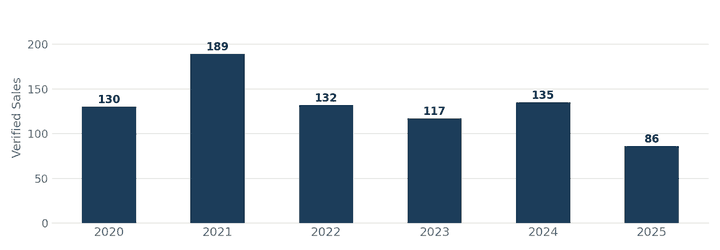
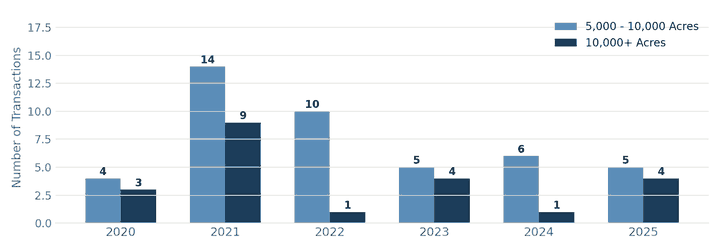
Eastern Montana’s land market ran hot from 2020 through 2023, posting the strongest percentage per-acre value gains of Montana’s three regions, before cooling into a steadier, more selective phase. Verified sales activity has been choppy since the 2021 peak, then fell sharply in 2025 to the fewest transactions of the period.
Eastern Montana Verified Sales Activity
Larger-Scale Transactions
Regional Median Value Trend
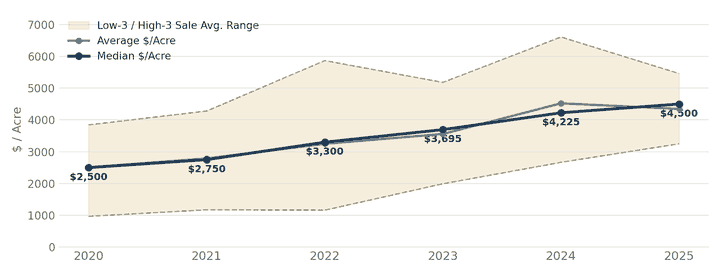
Median dollar-per-acre values in Eastern Montana (properties 40 acres and larger, all land types) rose 66% from 2020 to 2025 (+10.78% annually) — the strongest gain of the three regions. Nearly all of that appreciation came from a sharp +75% run from 2020–2023 (+20.51% annually). Values have since eased and the market appears to have leveled out.
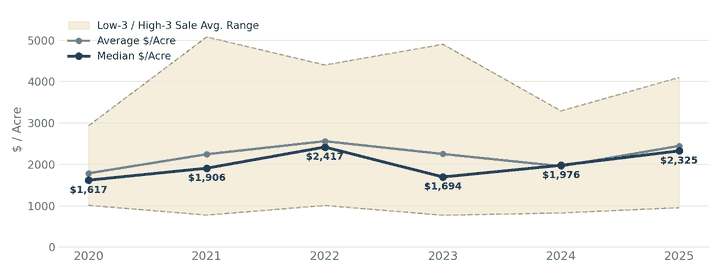
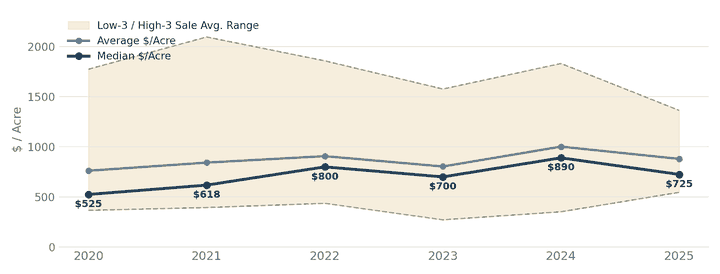
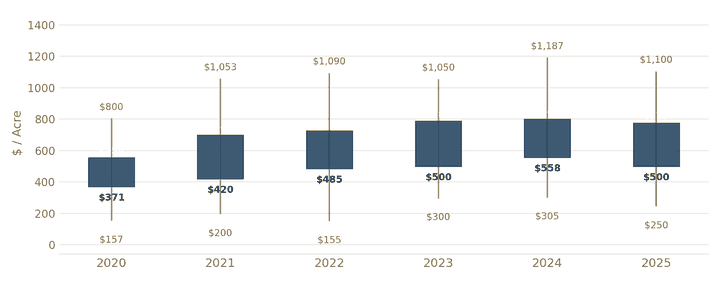
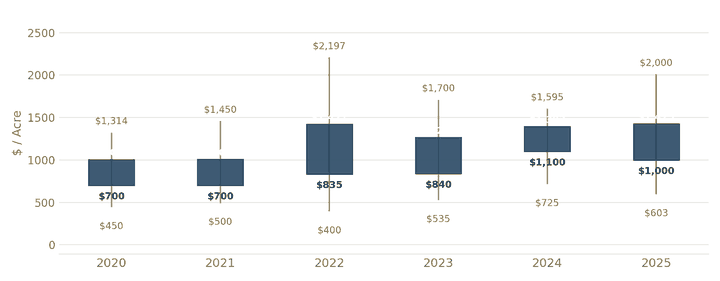
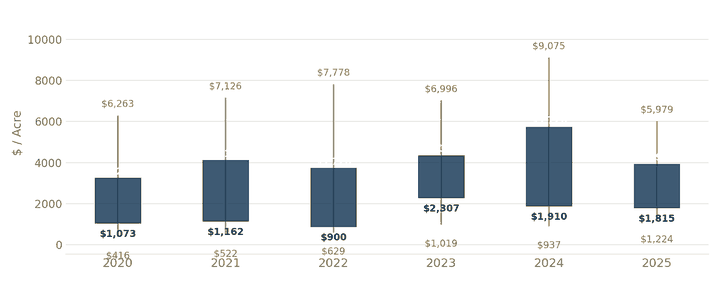
Bands below show the typical range and reported extremes for verified $/acre sales each year across Eastern Montana’s three primary land classes.
Pasture
Dry Cropland
Irrigated Cropland
Grazing Economics: AUM
Resale Appreciation
A review of properties that have changed hands more than once within the study period shows resale appreciation ranging from roughly 1% to as much as 17%, with the largest gains concentrated among properties held over shorter, more recent periods. This is a further signal of the market’s continued firmness.
Western Montana
Sales Volume & Unimproved Land Values
Western Montana continues to command the state’s highest per-acre land values, even as transaction counts have trended lower across the broader 40-acre-and-larger market.
Properties 40 Acres & Larger
| Year | Transactions | Dollar Volume | Acres |
|---|---|---|---|
| 2020 | 417 | $831,652,023 | 263,532 |
| 2021 | 402 | $1,591,274,194 | 524,489 |
| 2022 | 280 | $868,206,909 | 189,599 |
| 2023 | 225 | $793,853,497 | 197,414 |
| 2024 | 208 | $588,072,762 | 130,551 |
| 2025 | 164 | $727,804,424 | 129,631 |
Transaction counts have declined steadily since the 2020–2021 surge. Dollar volume has stabilized at a level still well above pre-2020 norms — a sign that per-acre values, not deal count, are now doing the heavy lifting.
Properties 640 Acres & Larger
| Year | Transactions | Dollar Volume | Acres | Avg $/Acre | Median $/Acre |
|---|---|---|---|---|---|
| 2024 | 22 | $271,657,550 | 87,081 | $4,107 | $2,813 |
| 2025 | 41 | $523,859,024 | 107,552 | $4,050 | $3,032 |
| % Change | +86% | +93% | +24% | -1% | +8% |
Figures exclude two transitional sales. A year earlier, average $/acre values were running roughly 13% ahead of 2021 levels. This year’s flat-to-slightly-down average points to a clear slowing in the pace of appreciation, even as transaction counts and total dollar volume climbed.
Unimproved Land Value Trend
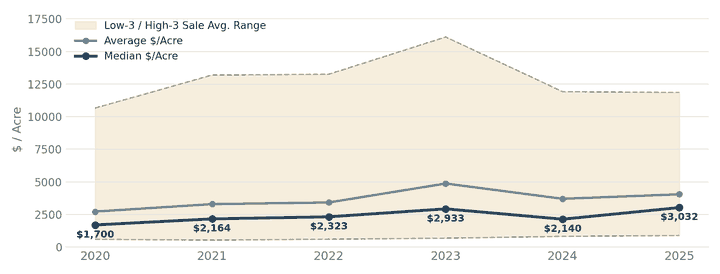
Values climbed steadily to $2,933/acre by 2023, then dipped to $2,140/acre in 2024. That dip does not reflect an actual decline in prices. Instead, it’s a reflection of what was selling. Much of the inventory that met market expectations had already sold in prior years. This created supply constraints, resulting in fewer upper-tier properties selling in 2024.
Scarcity continues to pressure values in the upper-tier ranch segment. When a property that meets market expectations becomes available, it draws multiple offers. These properties often trade off-market through broker relationships and can set new per-acre or per-transaction highs. This dynamic helped drive 2025’s rebound — a rebound that shows up more clearly in the sales volume figures above than in per-acre pricing alone. The number of 640-acre-and-larger transactions nearly doubled from 22 in 2024 to 41 in 2025.
Market Outlook
What’s Likely to Shape the Year Ahead
A handful of forces are likely to shape Montana’s land market in the year ahead:
Interest Rates
The market has remained comparatively insulated from interest-rate swings, dominated as it is by cash purchases. True agricultural properties in particular have proven surprisingly resilient through recent rate volatility.
Change in Property Tax
Montana’s new 2026 tax structure is intended to promote long-term housing by distinguishing primary residences and rentals from second homes and short-term vacation properties. Its impact on smaller, extensively improved recreational properties remains an open question worth watching.
Continued Demand, Patient Sellers
Demand remains steady, but buyers are more discerning and less willing to pay a premium for properties that fall short of expectations. Sellers, for their part, are patient: with little financial strain, few alternative investment options, and limited incentive to sell after several years of elevated activity, many remain reluctant to lower asking prices. Inventory levels are expected to stay low.
The Three D’s
Death, divorce, and debt have long been the most reliable sources of new listings in a low-inventory market. They remain the forces most likely to bring the next wave of properties to market.
© 2026 Norman C. Wheeler & Associates